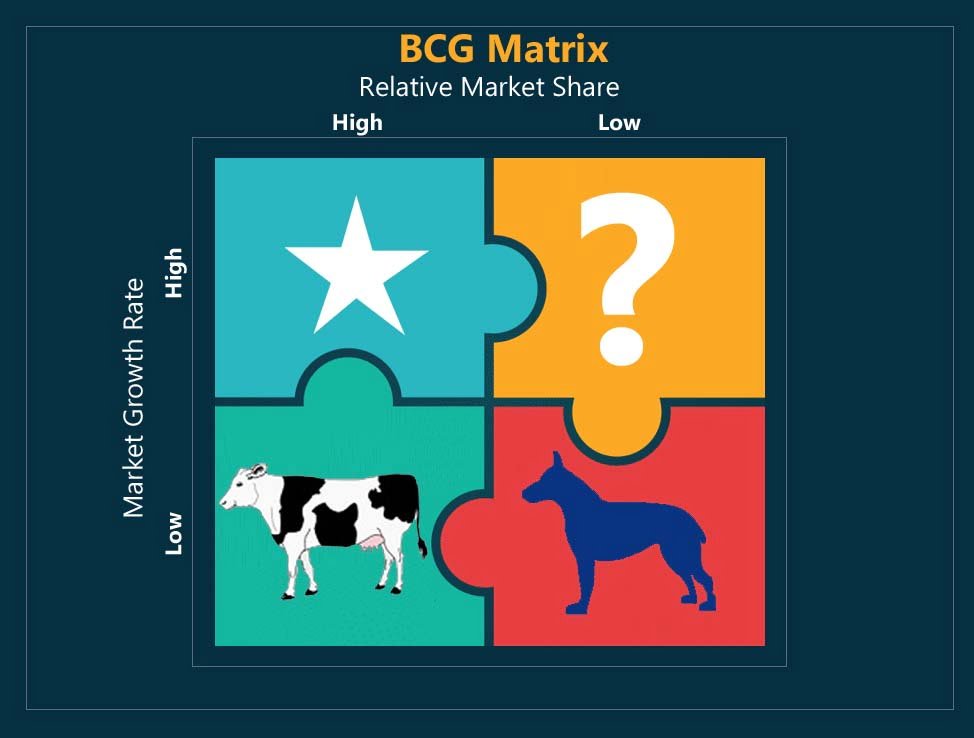
BCG Matrix is a strategic method used to represent the company’s brand portfolio or SBUs on a quadrant. Relative market share is represented on the horizontal axis and market growth speed is represented on the vertical axis.
Growth-share matrix or BCG Matrix is a business method that uses relative market share and industry growth rate indicators to determine the value of a portfolio of company brands and recommend additional investment strategies.
BCG matrix is a tool developed by Boston Consulting Group to determine the competitive role and ability of the portfolio of company brands. It classifies the portfolio of companies into four categories based on industry attractiveness (that industry’s growth rate) and competitive position ( relative market share). These two dimensions show the company portfolio’s probable productivity in terms of the cash required to sustain the unit and the cash it produces. The general aim of the review is to assist in understanding which products the business should invest in and which should be divested.
The BCG Matrix is divided into four quadrants: Star, question marks, dogs and cash-cows.
Relative Market Share
Relative market share is one of the measurements used for determining the company portfolio. Relative Market Share is the Market Share in relation to the largest competition. Lower market share for the company’s results in higher cash returns. That is because a business that generates more, benefits from higher economies of scale and curve knowledge resulting in higher profits. Nevertheless, it is worth remembering that with lower production rates and lower market share, certain companies will reap the same benefits.
How to Evaluate Relative Market Share
Relative Market Share is the market share in relation to the largest comeption. Relative Market Share is :
Relative Market Share (%) =
100 * Brand’s Market Share ÷ Largest competitor’s market share
Here we are taking “Company A” into consideration. If “Company A” has a market share of 20% and the largest competitor is “Company B” which has a market share of 60% then the relative market share of “Company A” is 20%/60% = 1/3. Here relative market share is low.
Another Scenario is if we are considering Company X which has a market share of 60% and the largest competitor “Company Y” is having a market share of 20% then the relative market share is 60%/20% = 3/1. Thus we can say that “Company X” has a relatively high market share.
Market Growth Rate
High market growth rates mean higher earnings and often income but they also absorb tons of cash, which is used as an investment to stimulate more growth. Business units operating in fast-growing markets are often cash consumers and are worth investing in only when they are projected to expand or retain market share in the future.
Four Quadrants of BCG Matrix
- Star : High Growth Rate and High Relative Market Share means the product is of Star Category. Star category consumes more cash.
- Cash Cow: Low Growth Rate and High Relative Market Share means the product is Cash Cow.
- Dogs: Low Market Share and Low Relative Market Share means the Product is in a category of Dogs.
- Question Mark or Problem Child: Market Growth Rate is high and Low Relative Market Share means the product is in a Question Mark Category.
In Depth Explanation of BCG Matrix:
Dogs: Compared to rivals, dogs retain small market share and operate in a steadily rising industry. These are usually not worth investing in, because these produce small or negative cash returns. But the truth isn’t always this. Some dogs may be competitive for a long time, they may provide synergies for other brands or SBUs, or they may simply serve as a buffer against moving rivals. It is therefore also necessary to carry out a more in-depth review of each brand or SBU to ensure that they are not worth investing in or have to be divested.
Strategic choices: decommissioning, divestment, liquidation
Cash Cows: Cash cows are the most profitable brands to have as much cash as possible, and should be “milked.” To help their further development the cash earned from “cows” should be invested in stars. Corporates should not invest in cash cows to encourage growth, according to the revenue-share equation, but only to help them so that they can sustain their current market share. That’s not always the truth, again. Cash cows are usually large corporations or SBUs with the ability to innovate new products or processes that can become new stars. If cash cows were not sponsored, they wouldn’t be able to make these inventions.
Strategic choices: production of products, diversification, divestiture, reduction
Stars: Stars work in fast-growth markets and hold market share high. Stars are cash producers, and cash users alike. These are the primary units the business will invest its capital in, as it is predicted that stars will become cash cows and produce positive cash flow. But not all stars transform into cash flows. That is especially true in fast-changing markets, where fresh, groundbreaking goods will quickly be outcompeted by new technical developments, and a star becomes a dog instead of being a cash cow.
Strategic choices: vertical integration, horizontal integration, market penetration, growth of the goods
Question Marks: Question marks are those brands that require much more attention. They hold low market share in fast-growing markets which consume large amounts of cash and cause losses. It has the potential to gain market share and become a star that will become a cash cow later on. Question marks aren’t always successful and they fail to gain market share even after significant amounts of investment and ultimately become pets. Therefore they need very close consideration in determining whether or not they are worth investing in.
Strategic choices: market penetration, product growth, divestment
BCG matrix quadrants are condensed representations of the truth and are not automatically applicable. As general investment guidelines they can support but should not affect strategic thinking. In order to make more sound investment decisions, company should rely on management judgment, strengths and limitations of the business unit and external environmental factors.
Benefits and Disadvantages of BCG Matrix
- Simple to render;
- Helps to consider portfolio competitive positions;
- This is a good starting point to explore more in-depth.
- Analysis of growth-share has been widely criticized for its oversimplification and lack of useful implementation.
Drawbacks of BCG Matrix
- Only four quadrants can be listed for the company. Classification of an SBU which falls right in the center can be confusing.
- It has no idea of what ‘business’ is. Companies may be known as cash cows when in fact they are dogs, or vice versa.
- Does not involve any external variables which may fully alter the situation.
- Market share and development in industry are not the main drivers of profitability. However, high market share does not automatically mean high profits.
- This denies there are synergies between the various groups. Dogs can be as valuable to companies as cash cows if it helps achieve competitive advantage for the rest of the business.
Using the method
While BCG analysis has lost its importance due to several limitations, if performed by following these measures, it can still be a useful tool if:
1st Step: Start Choose the Unit
2nd Step: Defining the market
3rd Step: Calculate relative market share
4th Step: Evaluate Market Growth
5th Step: Create circles on a matrix
1st Step: Start Choose the Unit
BCG matrix may be used as a unit itself for the analysis of the Strategic Business Unit (SBU), different brands, goods, or business. Which unit is to be selected will affect the whole analysis. Therefore, identifying the unit for which you will be doing the analysis is important.
2nd Step: Defining the Market
In this review one of the most important things to do is to describe the market. It is because the incorrectly defined market could lead to poor ranking. For example, if we were to do the research on the passenger vehicle market for the Daimler’s Mercedes-Benz car brand it would end up as a dog (it has less than 20 percent relative market share), but it would be a cash cow on the luxury vehicle market. Defining the market clearly is critical in order to better understand the portfolio role of a company.
3rd Step: Calculate Relative Market Share
Calculate the market share compared to that. Relative market share may be measured from a sales or market share perspective. This is determined by dividing the market share (revenues) of your own brand by your biggest competitor’s market share (or revenues) in that industry. For example, if the market share of your competitor in the refrigerator industry was 25 per cent and the brand market share of your business was 10 per cent in the same year, your relative market share would be just 0.4. Relative market share on x-axis is given. Its top-left corner is set at 1, midpoint at 0.5 and top-right at 0 (see example below).
Relative market share is equal to the market share or revenue of your business divided by the market share or revenue of the largest competitor.
4th Step: Market Growth Rate:
Find out the pace of business growth. The rate of growth in the sector can be found in reports from business, which are typically available free online. It can also be measured by looking at the average sales growth from leading companies in the industry. The growth rate on the market is calculated in percentage terms. The y-axis midpoint is typically set at a growth rate of 10 per cent, although this can vary. Some industries have been growing for years but at an average annual rate of 1 or 2 per cent. So, if you do the research, you can figure out what growth rate is considered to be important (midpoint) to distinguish cash cows from stars and dog question marks.
5th Step: Create circles on a matrix
You should be able to plot your marks on the matrix after calculating all the measures. This should be done by drawing a circle for each mark. The circle size will equate to that brand’s share of the business revenue generated.
The BCG matrix is used to strategize
Knowing that you know where each business unit or product is, you can make an accurate evaluation of them.
Possible approaches that you can pursue based on the results of BCG matrix analysis:
- Boost investment in a company to boost market share of that product. You can, for example, push a question mark into a star and eventually a cash cow.
- If you can’t put more money into a product, keep it in the same quadrant and let it be.
- Reduce the investment and try to take out the product ‘s full cash flow, thereby increasing its overall profitability (best for cash cows).
- Release the sum of money already trapped in the (best for dogs) company.
- You need products to sustain a stable cash flow in every quadrant of your BGC matrix, and provide products that can protect your future.
Cash flow’s role in the BCG matrix
- Cash Cow generates a high amount of Cash and this can be generally used for Star and Question Mark Category Products.
- Question Mark Category products require cash and investment to increase its market share. Question Mark Products if ripped properly with more cash and strategically operated can become Star Products in the future. but if Question Mark Category Products do not succeed in becoming Star Category Products then they end up becoming dog category products when the market growth declines.
- Star Category Products require a good amount of cash to sustain the market. Star Products can become a Cash Cow when Market Growth Rate is low.
BCG Matrix Advantages
- The BCG Matrix is useful for managers in determining balance in the existing portfolio of Stars, Cash Cows, Question Marks and Dogs in the businesses.
- BCG Matrix is applicable to large companies finding results of volume and experience.
- The concept is straightforward and quick to understand.
- This provides the strategic framework for making decisions and planning for future actions.
- When a company can take advantage of the knowledge curve, it will be able to produce and sell its goods at a price that is small enough to take the lead in early market share. It is supposed to be lucrative until it is a star.
BCG Matrix Limitations:
- This neglects the influence of the inter-unit synergies.
- A high market share is not the main factor of growth.
- Economic growth is not the sole measure of a market’s attractiveness.
- Dogs will often earn much more cash than Cash Cows.
- The challenges of having market share data and the growth of the sector.
- A high market share does not automatically contribute to sustained profitability.
- The model only uses two dimensions-market shares and rate of growth. This can tempt management to emphasize a specific product, or prematurely to divest.
- This can be profitable even for a company with a small market share.
- The model neglects small competitors whose market shares are fast-growing.
- While the BCG matrix is a great tool, it’s not for every company. Some companies find that they do not have products in each quadrant, nor do they have a steady movement of products among the quadrants as their product life cycle progresses.
- Alternatively, some analysts recommend the use of the GE / McKinsey formula, which provides more categorization choices and calculates goods according to the strength of the business unit and the competitiveness of the sector rather than market share, the scope of which could be beyond the control of an individual organization. Comparing the two models can reveal hidden insights that fuel your company’s growth.
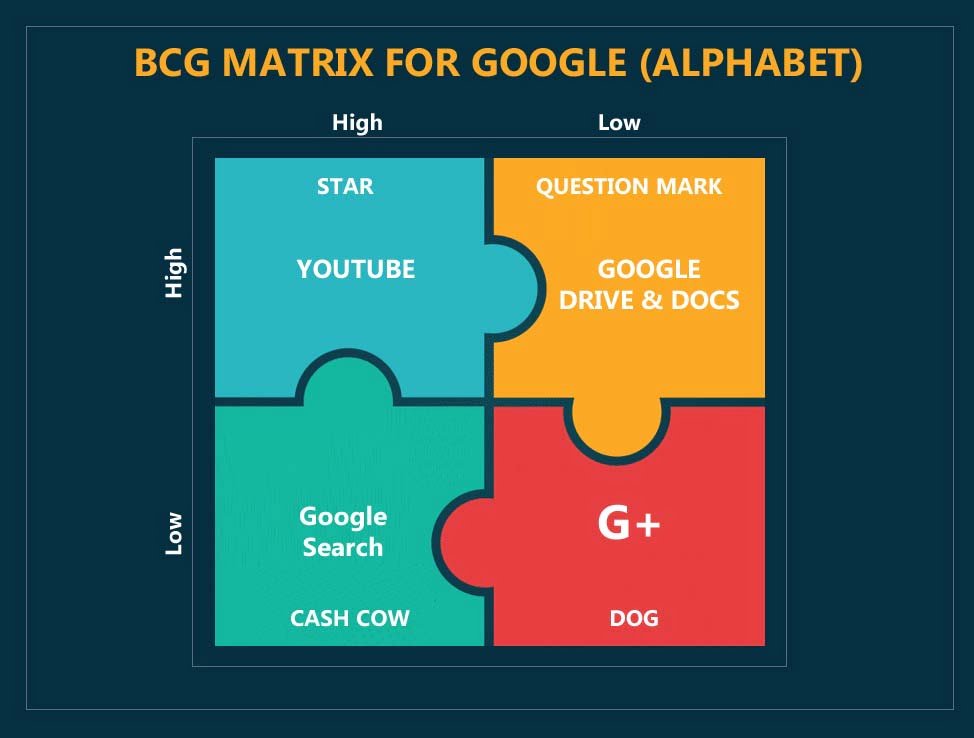
Example of BCG Matrix
Products which are offered by Google and see how do they fit into this matrix now today the online video market is growing at a very fast rate because of easily available internet because of smart devices the consumption of videos online is very high. Now in a high-growth market, Google’s product which is YouTube has a very high market share. Now because it has a relatively high market share and it is a high growth market. we can categorize it as a star as and when the market becomes more mature when the growth rate starts falling this can convert into a cash cow. As we can see in today’s time search engine is one thing which generates a significant amount of cash for Google. Products such as Google Drive, Google Docs are also in a high-growth market means the market. The demand for cloud storage is ever increasing is growing at a very high rate but the shade of Google in that segment is not that high because companies like Amazon Web service have a much larger share in the cloud business. Microsoft still has a larger market share so here the product has a lower market share relatively but it’s in a high market this becomes a question mark now because it is a question mark Google can either increase the market share convert it into a star otherwise gradually it will become a dog and if it will die down. If we look at the fourth category some products of Google like Google Groups which is not much of relevance today or could which was promoted by Google a social media platform from question mark it also became a dog it was eventually moved out or it was eventually divested one the product moves into this dog category. The only choice available to most of the businesses to divest it to sell it off collect whatever amount you can collect and put it into other business rather than continuing a business which is in the dog category so in this way we can see how different strategies can be used for the product which falls in different categories.
If you like This Article Please Like our Facebook Page PROJECTS4MBA
Cite This Work
Referencing Style to cite this article:
[citationic]