SWOT Analysis of Kansai Nerolac Paints focuses on Strengths, weaknesses, opportunities, and threats of the company. Strength and Weakness are the internal factors and Opportunities and Threats are the external factors which influence the SWOT of Kansai Nerolac Paints. Kansai Nerolac Paints Ltd is a prominent chemical industry with headquarters in Mumbai, India, established during the year 1920. It is the largest painting company in the industry and in decor. It is a large manufacturer of coatings and paints. The Kansai Nerolac Paints products are Industrial Coatings, Automobile Coatings, Marine Coatings, Protective Coatings, and Decorative Coatings. The company produces and supplies paint systems added to the process, electrical component finishing lines, material handling equipment, containers, bus bodies, and furniture industries.
The company had around five production plants for painting and another six or seven production contracts. At Jaunpur in Uttar Pradesh, Bawal in Haryana, Lote in Maharashtra, Hosur in Tamil Nadu, and Sayaka in Gujarat, the company’s own manufacturing plants remain. The organization has partnered with many other business leaders with much technological cooperation.
A wide variety of products-Kansai Nerolac Paints provides large types of products. The company’s key brand is a revolutionary technology product. The business sells exclusive goods that are eco-friendly. Decorative paints – interior and exterior wall paints, wood and metal surface paints, automotive coatings – top, transparent coats, touch-up paints, heat-resistant paints, auto-refinish products, underbody paints, and PVC sealants, performance coatings are the main products of this company.
Through this article let’s think about SWOT Analysis of Kansai Nerolac Paints.
Strengths in the SWOT Analysis of Kansai Nerolac Paints
Large Business of Coatings and Paints – Kansai Nerolac Paints is India’s largest coating and paint firm and is also a powder coating industry leader.
Tech-savvy – The company’s technical innovation has helped to develop and better serve the customers.
Excellent Research and Development-Kansai Nerolac Paint’s key attribute is its excellent R&D. The firm focuses more on research and develops new quality products to meet the requirements of the customer.
Branding and Marketing Strategy – The excellent branding and marketing strategy of Kansai Nerolac Paint has taken them to the top in the industry and to gain more recognition among the people.
Top customers in the list – The company has served many major automotive customers such as Toyota Kirloskar, Maruti Suzuki, Tata Motors, Ford, Honda, Yamaha, Volvo, Ashok Leyland, and so on.
Good supply chain – The business has an outstanding supply chain network to allow consumers access to the goods.
Celebrity ambassadors – Kansai Nerolac Paint is proud to have celebrities as its brand ambassadors to contribute to the company’s growth.
Awards and accomplishments – Kansai Nerolac Paints has won multiple awards in a variety of different functions.
Weakness in the SWOT Analysis of Kansai Nerolac Paints
Change in consumer demand – The decorative paint industry is a look and feels one, where the taste and experience of the customer tend to change quite frequently. With the change in fashion, the goods quickly become obsolete. It is a major drawback for the company, like product planning and inventory problems will arise.
Kansai Nerolac Paint’s business model-the the business model of Kansai Nerolac Paint can be easily replicated by its rivals. Therefore the organization would have to develop a development platform where manufacturers, suppliers, and end-users can be incorporated.
Costly Supply Chain and Logistics – Using the Internet and Artificial Intelligence, the Simple Material industry business model finds its way to become a market leader. Kansai Nerolac Paints supply chain must, therefore, be extremely costly in a robust way.
Opportunities in the SWOT Analysis of Kansai Nerolac Paints
Scope in New Products – Kansai Nerolac Paints has strong potential for developing new products that highlight the brand in a competitive environment.
Enhanced advances in technology – Technology improves manufacturing productivity, enabling manufacturers to manufacture more types of goods and services. This offers Kansai Nerolac Paints an opportunity to start pursuing new goods.
Opportunities online – Online services are growing and consumers prefer to take advantage of them very frequently. This also offers customers new products.
Low rate of inflation – Low rate of inflation brings with it greater price stability. It provides credit to the company’s customers at a low-interest rate. This increases the consumption of the company’s products thus offering them enormous opportunities.
New Products: New Products can be launched according to market demand and trends.
Offers on Bulk Purchase: Kansai Nerolac can capture the market by offering special discounts to Builders and Developers on bulk purchases.
Sanitizer Manufacturing: Company can enter to Sanitizer Manufacturing Industry as its demand is increasing and can be tapped easily and does not require extra licenses for the company.
Threats in the SWOT Analysis of Kansai Nerolac Paints
Changes in Regulations and Laws – Stringent guidelines and regulations on the quality of goods and production facilities are a major challenge to the operation of the company. Environmental policies are given more importance and the organization will need to constantly take care of that.
Raw material shortages – Raw material shortages and market volatility are also a major challenge to the company. Manufacturing is highly dependent on the raw materials; hence it gets affected when the raw material is unavailable or the prices keep fluctuating.
Competitor challenge – While Kansai Nerolac Paints is the leader in the paint manufacturing sector, it faces intense competition from both the local and international market.
Change in Government Policies : Any change in government policies regarding chemicals can directly affect the market of Kansai Nerolac Paints.
If you like This Article Please Like our Facebook Page PROJECTS4MBA
Cite This Work
Referencing Style to cite this article: [citationic]
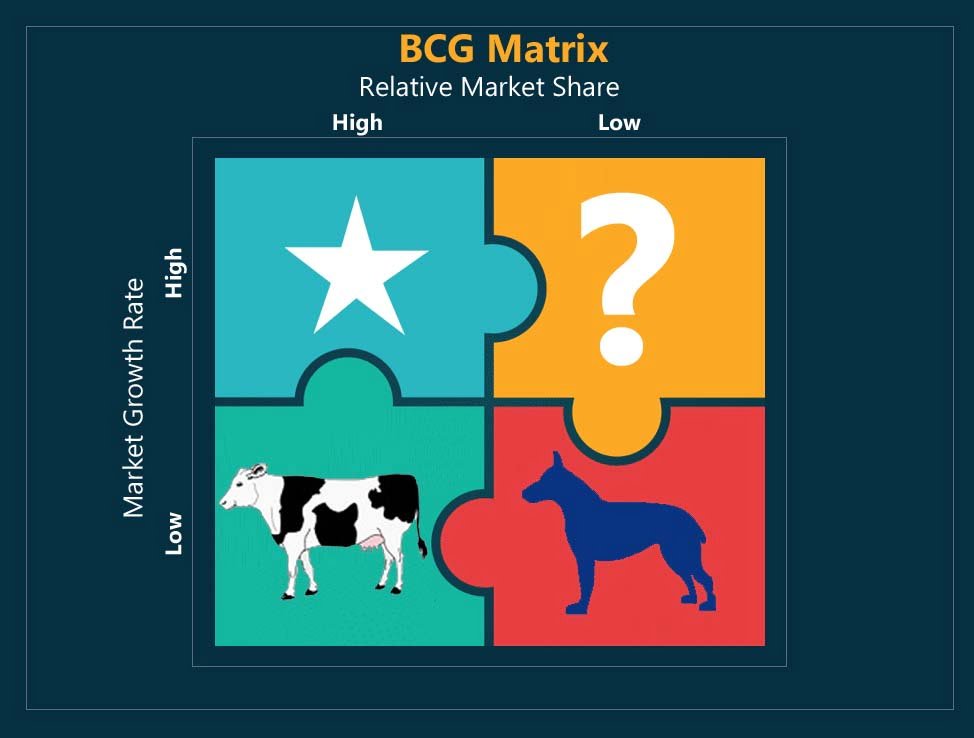
BCG Matrix is a strategic method used to represent the company’s brand portfolio or SBUs on a quadrant. Relative market share is represented on the horizontal axis and market growth speed is represented on the vertical axis.
Growth-share matrix or BCG Matrix is a business method that uses relative market share and industry growth rate indicators to determine the value of a portfolio of company brands and recommend additional investment strategies.
BCG matrix is a tool developed by Boston Consulting Group to determine the competitive role and ability of the portfolio of company brands. It classifies the portfolio of companies into four categories based on industry attractiveness (that industry’s growth rate) and competitive position ( relative market share). These two dimensions show the company portfolio’s probable productivity in terms of the cash required to sustain the unit and the cash it produces. The general aim of the review is to assist in understanding which products the business should invest in and which should be divested.
The BCG Matrix is divided into four quadrants: Star, question marks, dogs and cash-cows.
Relative market share is one of the measurements used for determining the company portfolio. Relative Market Share is the Market Share in relation to the largest competition. Lower market share for the company’s results in higher cash returns. That is because a business that generates more, benefits from higher economies of scale and curve knowledge resulting in higher profits. Nevertheless, it is worth remembering that with lower production rates and lower market share, certain companies will reap the same benefits.
How to Evaluate Relative Market Share
Relative Market Share is the market share in relation to the largest comeption. Relative Market Share is :
Relative Market Share (%) =
100 * Brand’s Market Share ÷ Largest competitor’s market share
Here we are taking “Company A” into consideration. If “Company A” has a market share of 20% and the largest competitor is “Company B” which has a market share of 60% then the relative market share of “Company A” is 20%/60% = 1/3. Here relative market share is low.
Another Scenario is if we are considering Company X which has a market share of 60% and the largest competitor “Company Y” is having a market share of 20% then the relative market share is 60%/20% = 3/1. Thus we can say that “Company X” has a relatively high market share.
Market Growth Rate
High market growth rates mean higher earnings and often income but they also absorb tons of cash, which is used as an investment to stimulate more growth. Business units operating in fast-growing markets are often cash consumers and are worth investing in only when they are projected to expand or retain market share in the future.
Four Quadrants of BCG Matrix
Star : High Growth Rate and High Relative Market Share means the product is of Star Category. Star category consumes more cash.
Cash Cow: Low Growth Rate and High Relative Market Share means the product is Cash Cow.
Dogs: Low Market Share and Low Relative Market Share means the Product is in a category of Dogs.
Question Mark or Problem Child: Market Growth Rate is high and Low Relative Market Share means the product is in a Question Mark Category.
In Depth Explanation of BCG Matrix:
Dogs: Compared to rivals, dogs retain small market share and operate in a steadily rising industry. These are usually not worth investing in, because these produce small or negative cash returns. But the truth isn’t always this. Some dogs may be competitive for a long time, they may provide synergies for other brands or SBUs, or they may simply serve as a buffer against moving rivals. It is therefore also necessary to carry out a more in-depth review of each brand or SBU to ensure that they are not worth investing in or have to be divested.
Cash Cows: Cash cows are the most profitable brands to have as much cash as possible, and should be “milked.” To help their further development the cash earned from “cows” should be invested in stars. Corporates should not invest in cash cows to encourage growth, according to the revenue-share equation, but only to help them so that they can sustain their current market share. That’s not always the truth, again. Cash cows are usually large corporations or SBUs with the ability to innovate new products or processes that can become new stars. If cash cows were not sponsored, they wouldn’t be able to make these inventions.
Strategic choices: production of products, diversification, divestiture, reduction
Stars: Stars work in fast-growth markets and hold market share high. Stars are cash producers, and cash users alike. These are the primary units the business will invest its capital in, as it is predicted that stars will become cash cows and produce positive cash flow. But not all stars transform into cash flows. That is especially true in fast-changing markets, where fresh, groundbreaking goods will quickly be outcompeted by new technical developments, and a star becomes a dog instead of being a cash cow.
Strategic choices: vertical integration, horizontal integration, market penetration, growth of the goods
Question Marks: Question marks are those brands that require much more attention. They hold low market share in fast-growing markets which consume large amounts of cash and cause losses. It has the potential to gain market share and become a star that will become a cash cow later on. Question marks aren’t always successful and they fail to gain market share even after significant amounts of investment and ultimately become pets. Therefore they need very close consideration in determining whether or not they are worth investing in.
BCG matrix quadrants are condensed representations of the truth and are not automatically applicable. As general investment guidelines they can support but should not affect strategic thinking. In order to make more sound investment decisions, company should rely on management judgment, strengths and limitations of the business unit and external environmental factors.
Benefits and Disadvantages of BCG Matrix
Simple to render;
Helps to consider portfolio competitive positions;
This is a good starting point to explore more in-depth.
Analysis of growth-share has been widely criticized for its oversimplification and lack of useful implementation.
Drawbacks of BCG Matrix
Only four quadrants can be listed for the company. Classification of an SBU which falls right in the center can be confusing.
It has no idea of what ‘business’ is. Companies may be known as cash cows when in fact they are dogs, or vice versa.
Does not involve any external variables which may fully alter the situation.
Market share and development in industry are not the main drivers of profitability. However, high market share does not automatically mean high profits.
This denies there are synergies between the various groups. Dogs can be as valuable to companies as cash cows if it helps achieve competitive advantage for the rest of the business.
Using the method
While BCG analysis has lost its importance due to several limitations, if performed by following these measures, it can still be a useful tool if:
1st Step: Start Choose the Unit
2nd Step: Defining the market
3rd Step: Calculate relative market share
4th Step: Evaluate Market Growth
5th Step: Create circles on a matrix
1st Step: Start Choose the Unit
BCG matrix may be used as a unit itself for the analysis of the Strategic Business Unit (SBU), different brands, goods, or business. Which unit is to be selected will affect the whole analysis. Therefore, identifying the unit for which you will be doing the analysis is important.
2nd Step: Defining the Market
In this review one of the most important things to do is to describe the market. It is because the incorrectly defined market could lead to poor ranking. For example, if we were to do the research on the passenger vehicle market for the Daimler’s Mercedes-Benz car brand it would end up as a dog (it has less than 20 percent relative market share), but it would be a cash cow on the luxury vehicle market. Defining the market clearly is critical in order to better understand the portfolio role of a company.
3rd Step: Calculate Relative Market Share
Calculate the market share compared to that. Relative market share may be measured from a sales or market share perspective. This is determined by dividing the market share (revenues) of your own brand by your biggest competitor’s market share (or revenues) in that industry. For example, if the market share of your competitor in the refrigerator industry was 25 per cent and the brand market share of your business was 10 per cent in the same year, your relative market share would be just 0.4. Relative market share on x-axis is given. Its top-left corner is set at 1, midpoint at 0.5 and top-right at 0 (see example below).
Relative market share is equal to the market share or revenue of your business divided by the market share or revenue of the largest competitor.
4th Step: Market Growth Rate:
Find out the pace of business growth. The rate of growth in the sector can be found in reports from business, which are typically available free online. It can also be measured by looking at the average sales growth from leading companies in the industry. The growth rate on the market is calculated in percentage terms. The y-axis midpoint is typically set at a growth rate of 10 per cent, although this can vary. Some industries have been growing for years but at an average annual rate of 1 or 2 per cent. So, if you do the research, you can figure out what growth rate is considered to be important (midpoint) to distinguish cash cows from stars and dog question marks.
5th Step: Create circles on a matrix
You should be able to plot your marks on the matrix after calculating all the measures. This should be done by drawing a circle for each mark. The circle size will equate to that brand’s share of the business revenue generated.
The BCG matrix is used to strategize
Knowing that you know where each business unit or product is, you can make an accurate evaluation of them.
Possible approaches that you can pursue based on the results of BCG matrix analysis:
Boost investment in a company to boost market share of that product. You can, for example, push a question mark into a star and eventually a cash cow.
If you can’t put more money into a product, keep it in the same quadrant and let it be.
Reduce the investment and try to take out the product ‘s full cash flow, thereby increasing its overall profitability (best for cash cows).
Release the sum of money already trapped in the (best for dogs) company.
You need products to sustain a stable cash flow in every quadrant of your BGC matrix, and provide products that can protect your future.
Cash flow’s role in the BCG matrix
Cash Cow generates a high amount of Cash and this can be generally used for Star and Question Mark Category Products.
Question Mark Category products require cash and investment to increase its market share. Question Mark Products if ripped properly with more cash and strategically operated can become Star Products in the future. but if Question Mark Category Products do not succeed in becoming Star Category Products then they end up becoming dog category products when the market growth declines.
Star Category Products require a good amount of cash to sustain the market. Star Products can become a Cash Cow when Market Growth Rate is low.
BCG Matrix Advantages
The BCG Matrix is useful for managers in determining balance in the existing portfolio of Stars, Cash Cows, Question Marks and Dogs in the businesses.
BCG Matrix is applicable to large companies finding results of volume and experience.
The concept is straightforward and quick to understand.
This provides the strategic framework for making decisions and planning for future actions.
When a company can take advantage of the knowledge curve, it will be able to produce and sell its goods at a price that is small enough to take the lead in early market share. It is supposed to be lucrative until it is a star.
BCG Matrix Limitations:
This neglects the influence of the inter-unit synergies.
A high market share is not the main factor of growth.
Economic growth is not the sole measure of a market’s attractiveness.
Dogs will often earn much more cash than Cash Cows.
The challenges of having market share data and the growth of the sector.
A high market share does not automatically contribute to sustained profitability.
The model only uses two dimensions-market shares and rate of growth. This can tempt management to emphasize a specific product, or prematurely to divest.
This can be profitable even for a company with a small market share.
The model neglects small competitors whose market shares are fast-growing.
While the BCG matrix is a great tool, it’s not for every company. Some companies find that they do not have products in each quadrant, nor do they have a steady movement of products among the quadrants as their product life cycle progresses.
Alternatively, some analysts recommend the use of the GE / McKinsey formula, which provides more categorization choices and calculates goods according to the strength of the business unit and the competitiveness of the sector rather than market share, the scope of which could be beyond the control of an individual organization. Comparing the two models can reveal hidden insights that fuel your company’s growth.
Example of BCG Matrix
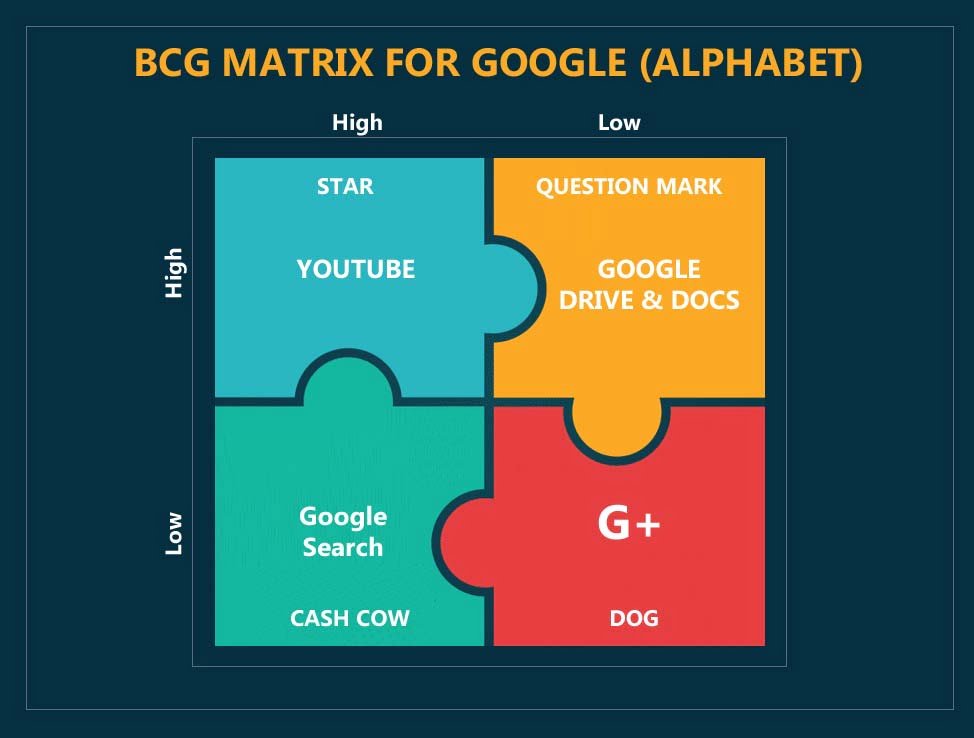
Products which are offered by Google and see how do they fit into this matrix now today the online video market is growing at a very fast rate because of easily available internet because of smart devices the consumption of videos online is very high. Now in a high-growth market, Google’s product which is YouTube has a very high market share. Now because it has a relatively high market share and it is a high growth market. we can categorize it as a star as and when the market becomes more mature when the growth rate starts falling this can convert into a cash cow. As we can see in today’s time search engine is one thing which generates a significant amount of cash for Google. Products such as Google Drive, Google Docs are also in a high-growth market means the market. The demand for cloud storage is ever increasing is growing at a very high rate but the shade of Google in that segment is not that high because companies like Amazon Web service have a much larger share in the cloud business. Microsoft still has a larger market share so here the product has a lower market share relatively but it’s in a high market this becomes a question mark now because it is a question mark Google can either increase the market share convert it into a star otherwise gradually it will become a dog and if it will die down. If we look at the fourth category some products of Google like Google Groups which is not much of relevance today or could which was promoted by Google a social media platform from question mark it also became a dog it was eventually moved out or it was eventually divested one the product moves into this dog category. The only choice available to most of the businesses to divest it to sell it off collect whatever amount you can collect and put it into other business rather than continuing a business which is in the dog category so in this way we can see how different strategies can be used for the product which falls in different categories.
If you like This Article Please Like our Facebook Page PROJECTS4MBA
Cite This Work
Referencing Style to cite this article: [citationic]
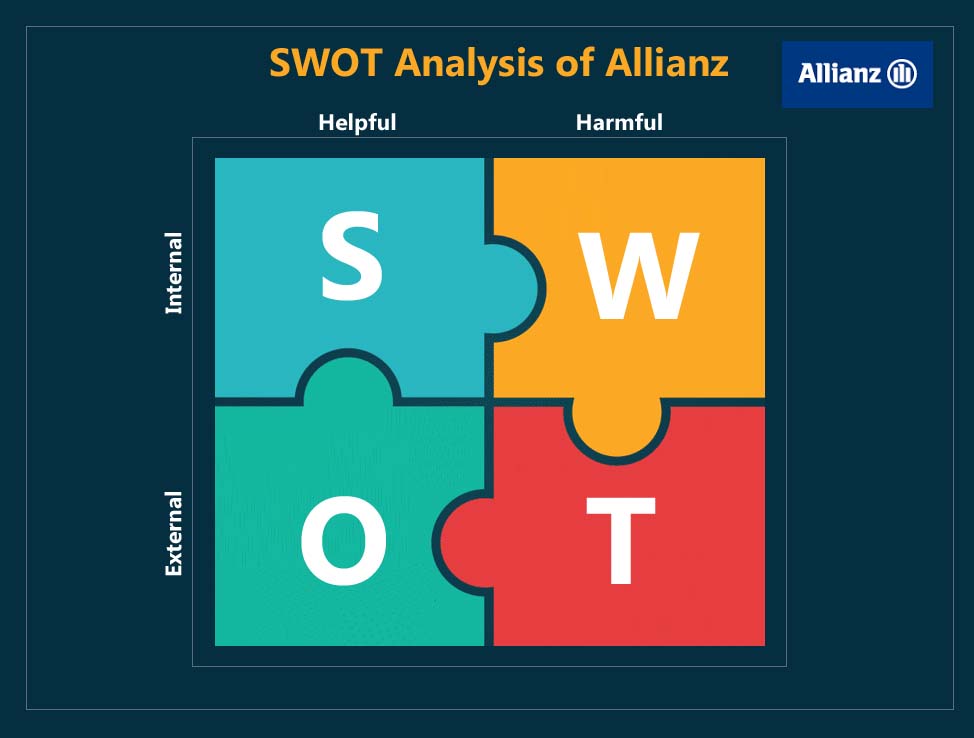
In this article, we will discuss the Marketing Mix of Allianz. Allianz SE is a multinational company involved in insurance and asset management business. It is among the top companies in the world. It is ranked as the largest financial service company according to Forbes Magazine.
Unit Linked Plans, Retirement Plans, Term Life Insurance, Child Insurance, Health Insurance, etc. Allianz is having good insurance policies. Claim Settlement of Allianz is also good. Some of the products and services offered by Allianz are :
Unit linked Policy [ULIP]
Asset Management Services
Banking and Finance Services
Home Insurance and Shop Insurance
Accidental insurance
Health insurance
Life insurance
Child plans
Pension Plans
Term Insurance
Place in the Marketing Mix of Allianz
Allianz has offices in more than 70 countries around the world. They have selected partners in other locations, enabling them to serve clients in more than 160 countries around the world. In India, Allianz has worked with Bajaj Finserv Limited to bring its international services and expertise to the country. Bajaj Allianz has a national network of 200 cities spread throughout the country from Surat to Siliguri and Kashmir to Thiruvananthapuram.
Its headquarters are in Pune, Maharashtra, and all the offices are interconnected.
Since it has a good network of offices around the world, its customers can easily and conveniently access its services.
Price in the Marketing Mix of Allianz
Premium is very competitive and the charges in Unit Linked Insurance Plans are also good. Term Insurance plans premium is also good. By offering value for money, Allianz Life Insurance was a trend-setter in the insurance industry. The organization is committed to provide its customers with the best and highest value products at minimum prices. It has kept the premium insurance policy prices at normal level so that large number of people can take advantage of its insurance plans. Allianz is fairly faces strong competition from other existing well established insurance companies. To build its own loyal customer base, it has introduced fair pricing strategies and has kept its premium rate affordable and pocket-friendly. The company has introduced penetration strategy to penetrate expanding insurance market.
Promotion in the Marketing Mix of Allianz
The publicity and advertisement plan of the Allianz corporate campaign is as follows:
Allianz seeks to attract new clients and maintain existing ones by delivering newer products and services, thus separating itself from its rivals.Some of the ways of Promotions are:
Sponsorships: Sponsorship plays a significant part in the advertising blend. Previously, Allianz called the stadium in Munich through a Facebook contest in which its global customers (approximately 80 million) were offered choices to choose from and the most proposed alternative was selected as the stadium name. That is how Allianz has served its customers. The company is also sponsoring other international sports platforms, such as Paralympics Games, Formula One, and Golf.
Brand Ambassadors: Allianz has established an arrangement with the musician Lang, who is employed as his brand ambassador. Allianz uses national and international sponsorships to form communities according to their interests and passions. Allianz believes that people play an important role in Allianz ‘s business in encouraging individuals to make progress in their lives. That’s why Allianz is heavily involved in sponsoring sporting events around the globe.
Advertisements: Allianz engages in TV commercials to communicate its latest offerings to its target audience. Ads are also seen on the News, Information and Sports networks. Digital Media and Print Advertising are also used in newspapers.
Mobile App: Allianz launched a mobile app that was an instant tax calculator that allowed users to calculate their tax liability. There was a 360-degree advertisement to market the app.
The company is also using social media platforms like Facebook, Twitter, Instagram to promote its business.
The company is also using Advertising Networks like Adsense and Meda.net and other video advertising platforms.
People in the Marketing Mix of Allianz
Allianz focuses a great deal on the people it interacts with, whether employees or customers. Employees play a key role in the services industry. Over 142,000 employees working with Allianz and providing services to 85 million clients worldwide. Employees have diverse backgrounds in order to provide services to customers with over 100 different job profiles. Workplace engagement is received on a daily basis to boost employee retention, commitment, activism, and pride. Allianz employees propose the best policies on the client’s needs, which also strengthens customer satisfaction.
Process in the Marketing Mix of Allianz
User requests should be answered easily. Allianz frees all procedures without any delay and limited documentation and formalities. The users are connected with the recently introduced offerings through its smartphone app. Both systems are streamlined and thus better support the customer.
Physical Evidence in the Marketing Mix of Allianz
Allianz maintains branches in big cities and towns around the country at accessible sites. The workplace setting with a friendly climate is given particular importance. The counters are placed in such a way as to provide prompt services without delay. The offices have a sleek look and sound with waiting rooms with sofas and newspapers. This covers the whole product spectrum of Allianz.
If you like This Article Please Like our Facebook Page PROJECTS4MBA
Cite This Work
Referencing Style to cite this article: [citationic]
This article focuses on the Marketing Mix of HDFC Life Insurance. HDFC Life Insurance is a venture between HDFC Ltd. and Standard Life. HDFC Ltd has a stake of 51.4% and Standard Life has a stake of 12.3% and rest of the stake. Remaining equity are hold by public. HDFC Life Insurance Limited has started its operations in the year 2000. HDFC Life Insurance Limited is the market leader in a Private Life Insurance company followed by SBI Life, and Bajaj Allianz. Some of the main competitors are :
HDFC Life Insurance has a customer-centric approach. The organization has long term savings and protection plans for different stages of life. The company has cost-effective products, good customer support, consistent growth in investments, and a fast claim settlement process.
Products of HDFC Life Insurance are:
Term Insurance Plans
HDFC Life Click 2 Protect Plus
HDFC Life Click 2 Protect 3D Plus Plan
Money Back Plan
HDFC Life Super Income Plan
Unit Linked Insurance Plans – ULIPs
HDFC Life Click 2 Wealth Plan
HDFC Life Classic One Plan
HDFC Life Sampoorn Nivesh
HDFC Life Click 2 Invest Plan Review
HDFC Life Capital Shield Plan
HDFC Life Pro Growth Plus Plan
HDFC Life Single Premium Pension Super Plan
HDFC Life Pro Growth Maximiser Plan
HDFC Life Pro Growth Flexi Plan
HDFC Life Smart Woman Plan
HDFC SL Pro Growth Super II
HDFC Life Young Star Super Premium
HDFC SL Crest
Whole Life Plan
HDFC Sampoorn Samridhi Plus
Endowment Plans
HDFC Life Pragati Plan
HDFC Life Super Savings Plan
HDFC Life Uday
HDFC Life Classicassure Plus Plan
HDFC Life Sanchay
Child Insurance Plan
HDFC Life YoungStar Udaan
Pension Plans
HDFC Life Assured Pension Plan
HDFC Life Guaranteed Pension Plan
HDFC Life Click 2 Retire Plan
HDFC Life New Immediate Annuity Plan
HDFC Life Personal Pension Plus Plan
Health Plans
HDFC Life Easy Health Plan
HDFC Life Cancer Care
HDFC Life Cardiac Care Plan
HDFC Life Click 2 Protect Health
Place in the Market Mix of HDFC Life Insurance
HDFC Life Insurance offers its coverage in every part of India and has a H.Q. in Mumbai, Maharashtra. It has a wide distribution chain that allows its consumers all over the world to supply their services. This covers insurance agent services, online insurance websites, insurance agents, direct networks and banking partner services. HDFC Life Insurance’s multichannel network has spread to almost nine hundred and eighty cities and towns in India, and is managed through an estimated three hundred and ninety-eight branches. The staff comprises two lakh financial consultants to effectively meet growing customer demand by providing individual attention. HDFC Life Insurance has formed a liaison bureau in Dubai.
HDFC Life has multiple channels for selling its policies. HDFC LIFE is selling its policies through its branches. Insurance Advisors are also recruited by the company. Bancassurance is also a channel for selling its policies. HDFC Life has branches all over the country to market its products. Marketing Executives are trained to explain the features and benefits of HDFC Life Insurance. HDFC LIFE is also selling its policies through Online Channel. HDFC Life has a simple claim settlement process.
Price in the Market Mix of HDFC Life Insurance
By offering value for money, HDFC Life Insurance was a trend-setter in the insurance industry. The organization is committed to provide its customers with the best and highest value products at minimum prices. It has kept the premium insurance policy prices at normal level so that large number of people can take advantage of its insurance plans. HDFC is fairly faces strong competition from other existing well established insurance companies. To build its own loyal customer base, it has introduced fair pricing strategies and has kept its premium rate affordable and pocket-friendly. The company has introduced penetration strategy to penetrate India ‘s expanding insurance market.
Promotions in the Market Mix of HDFC Life Insurance
HDFC Life Insurance differentiates itself as one of India’s most trusted brands. It has put its emphasis on CSR activities to improve the social conditions. It was the recipient of several awards for the various plans. Sar Utha Ke Jiyo is one of its most famous taglines, and has generated high visibility among consumers. HDFC Life has taken on several promotional activities to create positive awareness of the brand. Successful advertising campaigns have been launched on radio and several television channels through electrical media. Its advertisements appear in magazines, hoardings, and newspapers. It has an official website that provides interested parties with the related information.
HDFC Life is taking every possible measure to promote its policies. HDFC Life Insurance is using modern techniques for promoting its products and services. For Online advertisements the company is using Google Ad Network and other Ad Networks. The company is using Facebook Marketing, Whatsapp Marketing, and other online Marketing platforms for its promotion. HDFC Life is also advertising its products on Television, Print Media, and Magazines. It is also using Hoardings for promoting its products throughout the country. It is also promoting its products on various Social Media Platforms. These aggressive techniques are developing a good image among the customers of the company.
Insurance Advisors and Insurance executives are also promoting its insurance policies to the customers. HDFC is having a good customer centric approach and try to maintain good customer relations to retain customers.
If you like This Article Please Like our Facebook Page PROJECTS4MBA
Cite This Work
Referencing Style to cite this article: [citationic]
This SWOT Analysis of Cafe Coffee Day (CCD) focuses on Internal and External Factors. Internal factors are strengths and weakness and external factors are opportunities and threats. This SWOT Analysis of Cafe Coffee Day (CCD) analyzes strengths, weaknesses, opportunities, and threats of Cafe Coffee Day (CCD).
Let’s discuss SWOT Analysis of Cafe Coffee Day (CCD)
Strengths in the SWOT Analysis of Cafe Coffee Day (CCD)
Products of incredibly high quality and flavor – the coffee menu of Cafe Coffee Day is well-known and customers just love it. Besides this, Cafe Coffee Day has already launched some sandwiches and little bits that are a huge hit with people as well.
It’s a youth-oriented brand, catering to the millennial – it has a tremendous opportunity because 40% of the people joining the CCD are young.
It produces/grows the coffee it serves while reducing the cost – this is a crucial point for Coffee Day, and backward integration saves a lot of money.
The USP is inexpensive and convenience – you can stay in a Cafe for the entire day, and no one can ask you to leave. This warmth is the biggest USP of Cafe Coffee Day. Around the same time, the menu is inexpensive enough that people come to CCD from time to time and have a nice time.
Weaknesses in the SWOT Analysis of Cafe Coffee Day (CCD)
Losing its charm – The brand has lost its charm at the outset, mainly because it does not invest in promotions and Starbucks’ entry, as well as various local competitions, has affected the image of the brand.
There’s no power to sustain brand loyalty – it’s been a local coffee shop, but it’s not something people remain loyal.
Poor Ambiance and Decor-Many day coffee shops have a very poor atmosphere and decor. The flagship stores are beautifully run and push the reputation of the brand. Yet shops are still available with bad interiors. Anything the retailer should take care of since it’s a type of a franchise.
Many CCD stores are incurring losses due to incorrect site selection – this has hurt CCD over time as many CCD brand stores have been opened on the wrong site and not on the main roads. As a retail establishment, this also affects turnover and brand name.
Opportunities in the SWOT Analysis of Cafe Coffee Day (CCD)
Introduction of new items on the menu: Introducing more items and more offerings on the menu may increase the profits of CCD
Good interiors – Cafe Coffee day needs to uphold consistency in the interiors of all the outlets it provides. Once you head out of the city, you ‘re going to find the interiors to be much more shabby. It is a poor indicator of the price and durability of the brand.
Coffee is one of the fastest growing industries in Asia and recognition is rising with more and more foreign players joining the market.
More people like to visit CCD for informal meetings. Cafe Coffee Day can be advertised as a meeting point as well as a casual meeting point.
CCD has gone internationally and is planning to attract many new international markets, thus gaining international recognition.
Threats in the SWOT Analysis of Cafe Coffee Day (CCD)
Rivalry – Coffee Day has a lot of competition, particularly with other coffee Cafes like Barista, Mochas, Starbucks, McDonald’s, and others.
Indirect competition – Other hukka parlors such as Sheshas, Peshawar, Koylas, U-Turn also attract a lot of attention and prefer the younger generation to hang around, which in turn attracts the market captivated by CCD.
Government Regulations can be a major threat to Cafe Coffee Day.
Situations like COVID-19 can be a major threat to the earnings of the company.
If you like This Article Please Like our Facebook Page PROJECTS4MBA
Cite This Work
Referencing Style to cite this article: [citationic]
This McDonald’s SWOT Analysis – SWOT Analysis of McDonalds focuses on Internal and External Factors. Internal factors are strengths and weakness and external factors are opportunities and threats. This SWOT Analysis of McDonald’s analyzes the strength, weaknesses, opportunities, and threats of McDonald’s.
McDonalds is a leading player in fast food business. McDonalds is an American company founded in the year 1940 by Maurice and Richard.
McDonald’s was established in Bernardino, California. And within 8 years the store was turned into a fast-food chain. McDonald’s was acquired by Ray Korc and in the year 1955, he opened first franchise at Des Plaines, Illinois, and converted McDonald’s into a company.
McDonald’s is among the top 10 international fast-food chains with 37855 restaurants worldwide, including India, Canada, Australia, France, U.K., Poland, Germany, Japan, Netherlands, Italy, China, Russia, Sweden, Spain, etc.
Let’s do the SWOT Analysis of McDonald’s SWOT Analysis/SWOT Matrix. This article focuses on how McDonald’s takes the strategic advantage of its brand identity.
Strength in the McDonalds SWOT Analysis – SWOT Analysis of McDonalds
The following are the most influential facets of McDonald’s, which have assured sustainability, growth and ubiquitous brand identity of the company.
Brand Popularity: McDonald’s is the most popular brand in the world. Despite an unparalleled market image, the company dominates the restaurant business irrespective of the tough competition.
Good Taste: McDonald’s Potato French fries are popular because of its taste. McDonald’s French fries are great tasting potatoes, says the consumer report.
McDonald’s has developed Real Estate Empire: Aside from selling burgers and fries, McDonald’s has developed Real Estate Empire. McDonald’s has a fast food retail chain across the globe. McDonald’s is expanding its roots across countries. McDonald’s has around 37855 fast-food chains across 120 countries. McDonald’s franchise is operating somewhat differently. McDonald’s not only offered its brand name, products, materials, franchisees’ operations but also makes money from rent collected.
Technological Advancement: McDonald’s fulfills its vision of “Digital Engagement” through technological advancements. Initiatives such as the introduction of Website and Mobile Applications gives an added income to McDonald’s.
Analytics and Information Collection: Company is collecting data and analyze the demands of the customers to generate attractive offers.
Market Recognition: McDonald’s holds the prestige of becoming the world’s most popular fast-food brand.
Believes in Safety and Health Concerns of Customers: You can debate the flavor and overall consumer service, but McDonald’s consistency level has always been a selling point. The Organization enforces full product health and consistency procedures when sourcing products from third-party intermediaries. McDonald’s has also started to ban the use of high-value human antibiotics. The World Health Organization (WHO) has described human medicine as the “top priority critically essential antimicrobials” (HPCIA) in its global chicken supply since 2018. A variety of public health and community advocates are also appreciative of this strategy because it is a successful attempt to avoid harmful bugs.
Leading fast-service restaurant: It is a fast-service restaurant chain in the World. McDonald’s services are fast and error-free. This quality has set the standards for the company in a fast-food market.
Attractive offers and New Ways of Publicity: McDonald’s Combos are famous for their value and taste. McDonald’s is using modern ways of promotion. Promotion includes Promotions through Google Ads, Instagram Promotions, Facebook Promotions, Social Media, and Television.
McDonald’s Fast Food is loved by a youngster: Youngsters love to visit McDonald’s to have their meals.
Weakness in the McDonalds SWOT Analysis – SWOT Analysis of McDonalds
Here are some of the weakness of McDonald’s fast food retail chain.
Franchise Model of Business: McDonald’s is the perfect example of a multinational franchise model. Risks of loss, disappointment with the consumer, mismanagement, and poor sales growth. The organization is heavily dependent on franchises that run individually and thus have no influence on their day-to-day activities, so it directly affects the brand.
Supply Chain: McDonald’s fast-food chain also faces challenges due to delays in the supply chain. This also restricts the supply of goods that are essential to operations. As a result, as a franchisee faces these interruptions, operating costs escalate, resulting in reduced sales and decreased productivity.
Problems related to Employees: Owing to recent employee-right protests around the world and expanded pay caps, many companies have encountered critical discontent from workers. McDonald’s also faced intense criticism from its employees. The employees went on a series of rallies and strikes demanding that their minimum pay be increased on $15 an hour, costing the company’s reputation loss.
Lost Appeal in Breakfast Segment: Same breakfast menu creates a hurdle in the path of McDonald’s they must change their menu to generate more revenue.
CEO was shot In November 2019, McDonald’s CEO, Steve Easterbrook, was terminated following a romantic relationship with the employee. It has broken corporate policies. The board also reported that Steve had “demonstrated bad judgment.”
Opportunities in the McDonalds SWOT Analysis – SWOT Analysis of McDonalds
The following opportunity segment for McDonald’s outlines the developing prospects for expansion. This will help the organization boost its financial efficiency, organizational structure , strategic development and other facets.
New Pricing Opportunity: McDonald’s unveiled the new “$1, $2, $3” menu and “2 for $5 Mix and Match Deal” for its customers. The menu has resulted in improved sales.
Innovative Menu: McDonald’s will make sure to add fresh, creative items to their menu and help people prefer them instead of fresh fast-food chains. Introducing more such products according to local environments and communities will help McDonald’s retain their appeal for a longer period of time.
Global Expansion: McDonald’s reign over the US, but it is also battled on the world market. Nevertheless, the organization has a strong opportunity to pursue its worldwide growth by relying more on overseas markets than on the various states of -America.
Building Good Brand Identity: McDonald’s is maintaining its offensive, nutritious and personalized offers. These innovations have started to demonstrate results, with strong comparative sales contributing to an improvement in earnings. McDonald’s is not compromising its quality and rates. McDonald’s has created a good brand identity.
App order and Delivery: McDonald’s has launched a relationship with Zomato and Swiggy to deliver food. Such mobile order and distribution programs allow McDonald’s to fulfill the ever-changing demands of its customers.
Threats in the McDonalds SWOT Analysis – SWOT Analysis of McDonalds
The challenges or threats factor is related to a trend that prohibits the organization from taking full advantage of the strengths. So, these are the only challenges that McDonald’s faces.
Infrastructure Innovation Programs: While the creative developments introduced by McDonald’s have an optimistic future, innovation in technology is always risky. McDonald’s ROI decreases because of the adoption of New Technology and Innovative Infrastructure.
Tough competition from rivals: McDonald’s is getting tough competition from Burger King, Wendy’s, and Chick-fil-A.
Cultural Risk: McDonald’s has to face numerous cultural challenges in various areas of the world, creating harm to the brand’s reputation. It was also a very challenging job for McDonald to operate with the franchise model. McDonald’s has also faced problems in Muslim Countries. Controversies for not using Halaal food has deteriorated the image of the brand.
New Era Fast Food Phenomenon: Due to McDonald’s conventional menu and taste restaurant chains such as Wendy’s and shake shack take full advantage of their mostly tried-and-tested menu and recipes for choice.
Constant care for the climate: Like every other fast food company, McDonald’s is under extreme pressure to change its activities and reduce waste, which creates environmental contamination.
Changing Governmental Policies: Government policies related to FDI may affect the business of McDonald’s. Growing ecological issues call for McDonald’s to take steps in this regard and set a precedent for other food sources, but this is not that easy.
The use of Plastic is also banned in some regions hence McDonald’s has started the use of Paper Straw.
Conclusion
McDonald’s is one of the leading food companies of all time, creating tremendous innovation and customer engagement. However, due to the continued history of the company, it keeps a close eye on the things that can create problems.
In this McDonald’s SWOT analysis, we outlined each of the strengths, limitations, prospects and risks that McDonald’s faces on the market.
If you like This Article Please Like our Facebook Page PROJECTS4MBA
Cite This Work
Referencing Style to cite this article: [citationic]
Honda Motors is a company that has been admired for the excellent vehicles it has provided us with since ages. Honda is a smart player on the market and is considered to be one step ahead of the market and hence the company has never suffered in its tenure for decades.
Strengths in the SWOT Analysis of Honda Motors – Honda SWOT Analysis
Largest manufacturer of motorcycles – There are many feathers in Honda motor cap but one of its greatest benefits is that it is the world’s largest producer of motorcycles. It has a largest share of the motorcycle market.
The largest producer of internal combustion engines – Including motorcycles, Honda motors also have a major presence on the market for combustion engines used for aircraft, jet skis, yachts, or other heavy engine use.
Eight largest car makers – Honda Motors is now the eight largest automotive producers in addition to being the world’s number one automobile manufacturer. It has a solid, localized portfolio of products.
Great R&D – One of the reasons Honda has managed to reach such heights is due to its emphasis on R&D and its R&D workforce. So Honda still comes up with sleek and innovative designs that are a success on the market.
High-tech products – Because Honda has high-tech products, the entry barriers are high and, hence, the brand has not been beaten in the last few years. When you combine Honda ‘s complete product portfolio, you’ll understand how technically the firm is solid.
Over the years, brand value – Honda was able to offer hit goods after reaching the goods. The Honda Accord is one of the most loved cars and so is the Honda CRV. In motorcycles, there are many highly engineered items that put Honda well ahead in its brand image than a lot of its rivals.
Large employee base: Honda has given employment to 215,638 people. They are the real asset of the company.
Product portfolio-Honda ‘s product portfolio is massive. It has at least 100 types of cars and other automobiles, 100 types of bikes and scooters, it has power equipment such as generators, it manufactures high-quality engines, it has its own helicopters, mountain bikes, and all-terrain vehicles. Which also looks into hybrid and renewable-powered vehicles? As you can see, all of these products are technologically advanced and have their own brand value, coming from Honda’s building.
Market share – As can be seen from the above points, Honda has a large market share of most of the goods it produces, owing to its manufacturing advantage.
Good Engine Quality of Vehicles.
Weakness in the SWOT Analysis of Honda Motors – Honda SWOT Analysis
High Manufacturing Costs– Obviously, with a strong R&D budget and state-of-the-art technology, commodity costs are high and end-customer prices are often high. It may be Honda’s vulnerability but it has to have its vulnerability because by reducing prices it can not reduce its brand value.
Upper Middle Class are Target Customers – A common criticism for Honda cars is that cars are only for the upper-middle class and Honda wants more car portfolio for the lower middle class already targeted by other car manufacturers such as Hyundai and Maruti.
Indian hero and honda separation – Honda engines suffered badly, at least in India, when Hero and Honda split. Honda has had to replan her involvement in India as a result.
Opportunities in the SWOT Analysis of Honda Motors – Honda SWOT Analysis
Electric and alternative fuel vehicles – This section is oriented towards the future of the automobile industry where people will be seeking the use of renewable energy as fuel such as petrol and diesel and CNG have their limits.
Increasing vehicles – Growing the number of cars around the world. Most of the reasons for this are the rise in individual buying power, another is that owning a motorcycle or a car now is a social standard. Consumption is now at an all-time peak.
Expansion in developed countries – Due to increased buying power and easy car loads provided by banks, automobile purchases are growing, especially in developing countries. Honda needs to take full advantage of this upsurge in demand and rapidly seize the market.
Market expansion – two strategies widely employed by car producers are introducing more products to the inventory and creating more models to expand the product line. A lot of considerations need to be performed before a new concept is introduced. However in a competitive market , product expansion is the secret to rising.
Threats in the SWOT Analysis of Honda Motors – Honda SWOT Analysis
Competition – Competition by local and regional or national players in each of the countries in which it is present dent Honda ‘s revenues.
Fuel prices – While people now have more money to purchase vehicles, increasing fuel costs are worrying us and are one of the reasons why many people are still reluctant to buy vehicles, since later on the fuel costs charged are more than the cars.
Rising transportation and other costs – Transportation as well as production and labour costs are one of the things that plagues all car manufacturers. These costs are still on the rise with inflation, and are always a problem.
If you like This Article Please Like our Facebook Page PROJECTS4MBA
Cite This Work
Referencing Style to cite this article: [citationic]
The purpose of this comprehensive SWOT analysis of Tide is to analyze Tide’s internal and external factors. It’s about looking at the Tide’s strengths and weaknesses. This article also seeks to discuss the opportunities that Tide should grab and the possible threats that it should keep an eye on.
Tide is a powdered detergent that is manufactured by (P&G) Procter & Gamble. Tide Detergent was launched in the year 1946. Tide was the first detergent to be sold nationwide. The P&G has 6 detergent powders range and one liquid detergent range under Tide brand name.
Strengths in the SWOT Analysis of Tide – Tide SWOT Analysis
The flagship brand P&G – Tide celebrates the luxury treatment of being the flagship company of P&G. P&G also enhances the brand in order to build itself in the minds of consumers.
High-quality detergent at a lower price – Tide is playing on the USP to offer a higher quality product at a lower price and the company has so far been successful in achieving its objective. Customers are pleased with the quality of the goods and the costs are comparatively cheaper than those of the traditional rivals.
Current logistics and sales networks of P&G have been tremendous support – through the years, P&G has established good delivery and sales networks, and Tide profits tremendously from maintaining the same network without needing to spend any time in manufacturing and procurement activities.
Leading market share – Tide has gained from one of the largest brands of detergents, making them an additional bonus in exploring and innovating new goods to further boost their market position.
Strong emphasis on the value of whiteness – Both of Tide’s ads expresses the whiteness idea that they have been able to maintain effectively. That has also allowed them to concentrate on the USP that people wanted.
Solid brand recognition and awareness – Tide has become a household name and needs no introduction. They have been successful in targeting the company to the right audience, which has allowed Tide to retain high brand awareness on the market.
Tide is broadly distributed in all countries – the presence of the product in both rural, semi-urban, and industrial regional areas allows it the preference of every commodity that continues to keep consumers faithful to the brand.
Weaknesses in the SWOT Analysis of Tide – Tide SWOT Analysis
Old major rivals – The rivalry is massive and among the large corporations of the world, which is why Tide can not cause such big-name players to sacrifice their competitiveness in the market.
Similar or alternative goods are sold locally at much cheaper prices – as Tide sells itself as a low-quality detergent and more high-cost detergents are sold on the local market. This low price approach also serves as a negative influence on the company.
The industry is already established – the demand for detergents is now established and consumers want businesses to come up with something different. In order to offer this little difference, the player will often be totally removed from a competitive market like this one.
Opportunities in the SWOT Analysis of Tide – Tide SWOT Analysis
Introducing new products with advanced technologies and creativity – this is what our consumers are searching for and with mainstream goods such as detergents. There’s something Tide can explore in this place.
Rural markets have a strong opportunity – rural consumers are changing to use these new detergent goods at a very fast rate. This is a chance for a company like Tide to make good use of this chance.
Can Tide find a niche consumer audience on its own – any commodity is priced on the USP and for Tide, it is white at a lower price. It would be fascinating to see how they could discover and find for themselves a niche market that could establish a monopoly for them.
Shifting people’s habits – this is also an advantage. Put the best analysts in there to find out what this group needs and plan it. That will only happen if an organization will consider and respond effectively to the can needs of customers.
Seek new markets – While Tide is still present in many countries of the world, spreading deeper into new geographies is rarely a bad move, given that it is carried out with due care.
Threats in the SWOT Analysis of Tide – Tide SWOT Analysis
Imitation products – It is very simple for detergents to market fake items with identical names and labeling for a drug like detergent.
Market wars with rivals – Because competitors in the industry are all major corporations, often price wars prove lethal to one or the other.
Rival Ambush Marketing – Many businesses also use ambush marketing to tarnish the reputation of another company with such consumer goods. It is critical for a brand like Tide to always be at the forefront of these threats.
Changes in tax policies – Items like this, where a company battles for only the slightest advantage, a shift in tax policy will prove to be a big challenge.
Is the drug safe – the detergent is a substance where a lot of additives are used in the manufacturing of the product. In this situation, Tide will guarantee that, by all means, they comply with all the laws required to ensure that they are safe and environmentally sustainable.
Government Policies against Surfactants and chemicals can be a major threat.
If you like This Article Please Like our Facebook Page PROJECTS4MBA
Cite This Work
Referencing Style to cite this article: [citationic]
SWOT Analysis of Peter England focuses on strengths, weaknesses, opportunities, and threats. SWOT Analysis of Peter England is done to analyze the Internal and External Factors. Internal Factors are Strength and Weakness and External Factors are Opportunities and Threats.
Peter England becomes the popular fashion brand that was established in Ireland in 1889. At the time of the Boer War, it was introduced to supply British troops with fine khaki trousers. Over the years, the company has also made its entrance into the Indian industry. During the year 2000, this company was purchased by the Aditya Birla Group and became India’s leading Menswear brand.
This company has been ranked among the top five most influential brands in the apparel industry for almost seven consecutive years. Holding a fashion trend in line, Peter England offers apparel that caters to every fashion opportunity in professional life. Having a deep interest in authenticity, this brand has become the most respected and responsible foreign brand to offer unmatched value to many young Indian people.
Having a strong presence in formal and casual wear for people, this company offers an creative range of specific clothing categories such as jeans, seasonal wear, linen, kurtas, accessories and more. The firm has its operating operations in around 150 cities and more than 700 brand outlets.
The company also offers comfortable workplace and casual wear across the numerous sub-brands of Peter England Products. The sub-brand Peter England Elite is the manufacturer of Luxury Formal Wear.
Strengths in the SWOT Analysis of Peter England – Peter England SWOT Analysis
Various types of apparel – Peter England offers apparel that is suitable for the workplace and people who want a sense of style in their clothes. It contains a number of lines, such as Peter England, the largest menswear brand, Peter England Components, which is casual office wear, and Peter England Elite, which is a luxury office wear.
Good Brand Image – The Peter England market is very successful and has a high brand recognition amongst the people.
Most Respected Clothing Company – the Peter England company has been named India’s most popular clothing brand. The brand’s clothing is a class in society.
Fashion Brand – Peter England offers luxury and international apparel to consumers and is available at all locations.
Occasion Driven Fashion – Peter England has attire that fits multiple events, such as formals, weddings, and parties.
Popular Menswear brand – Peter England is one of the biggest menswear companies and is expected to sell about six million garments per year.
Awards and Acclaim – Peter England also won several awards over the years, including Best Men’s Performing Brand Formal, Casual Wear and Consumer Satisfaction Summit in 2017, Best Marketing Campaign in 2015, and Most Respected Company in 2014.
Greater number of purchasing orders – Peter England has a large number of purchase orders, which is a big boost to the company.
Clothing is always up-to-date – Peter England’s clothing is always up-to-date with the new trendy trends to suit consumers ‘ needs.
Rewards Plan – Peter England has a creative and effective incentive system that helps regular buyers to receive points for any order.
Online Presence – The products of the brand are accessible online on their business website. This makes it convenient for shoppers to shop everywhere.
Weaknesses in the SWOT Analysis of Peter England – Peter England SWOT Analysis
Small Global Footprint – has a restricted global reach relative to the other multinational company.
Powerful competition – The Peter England brand has a lot of rivals in both Indian and foreign markets. Such brands give most to consumers and thus there is a strong chance of a change of name.
Opportunities in the SWOT Analysis of Peter England – Peter England SWOT Analysis
Indian Wear Growth Potential – Peter England can expand its business to further grow Indian wear. This will encourage them to service customers who have been looking to wear Indian clothing for a variety of occasions.
Peter England to expand High Price clothings – Peter England will look to expand the product line to the higher price category of fashion or textiles.
Increase Global Footprint – The company should consider opportunities to extend its overseas market that will boost brand growth.
Mobile App – The company should have a smartphone app on both channels that can help the business expand as more and more customers continue to use their apps to buy.
More Structured Business Suite – The organization should create more formal business suites to increase brand awareness.
Threats in the SWOT Analysis of Peter England – Peter England SWOT Analysis
Emerging Brands – Many different products that have come into posing a significant challenge to the Peter England brand due to a common form of pricing.
Local labels with common trends – Several identical trends are available at cheap rates in many other local or ethnic products. It’s a major challenge for the company.
Imitation Product – Inexpensive imitation of the actual product is often a significant challenge to the company.
Socio-economic – The effect of the economic downturn is a significant threat to the company, as consumers may delay their transactions to cover increased costs.
Government policy – Shifting government policies will have a major effect on companies.
If you like This Article Please Like our Facebook Page PROJECTS4MBA
Cite This Work
Referencing Style to cite this article: [citationic]
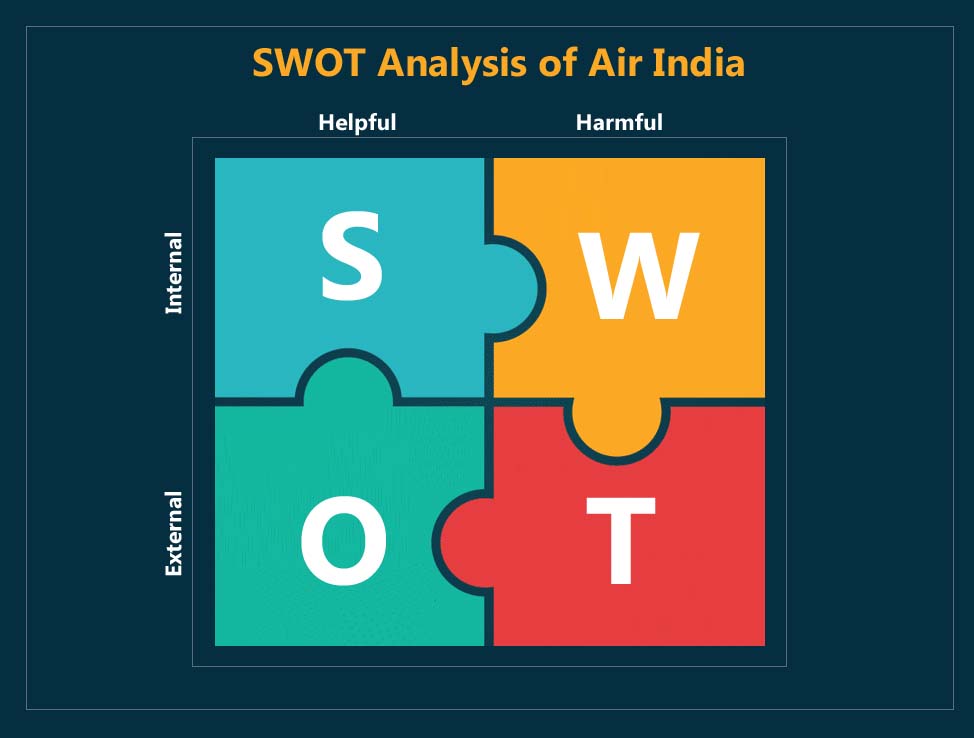
The purpose of this comprehensive SWOT analysis of Air India is to analyze Air India’s internal and external environments. It’s about looking at the airline’s strengths and weaknesses. This also seeks to discuss the possibilities that Air India should pursue and the possible threats that it should keep an eye on.
Strength in the SWOT Analysis of Air India – Air India SWOT Analysis
Air India is one of India’s main providers of flight services. This is India’s flag carrier airline, as well. Indira Gandhi International Airport, New Delhi (India) is the airline’s hub. Air India is known to be a leading service provider.
Air India has served 101 destinations including 57 domestic destinations. It travels to 33 countries all over the world, spanning four continents. This has a large number of new Airbus and Boeing airplanes. Air India has arrangements for code-sharing with a range of airlines around the world.
Air India is India’s largest State-owned airline. It enjoys therefore financial assistance from the Indian government. Air India is also known for the quality of its services.
Weakness in the SWOT Analysis of Air India – Air India SWOT Analysis
Air India is in a financially vulnerable position. Air India is facing financial losses. The airline has in reality made continuous losses and incurred massive losses. In the past decade, the total losses swelled to around 69,575.64 crores. The Indian government has declared a decision to sell the carrier, due to financial problems and some other issues.
Air India operates through large international and domestic markets, competing with leading world-class giant airlines as well as small local operators. This lack of clarification about the strategic path dilutes its strengths in large measure and confuses its brand within markets.
Low productivity, low power usage.
Growing Competitor base and low-cost carrier entry (LCC’s)
The high-cost structure of the airline and the compulsions to be a member of the public sector are the reasons it suffered a loss and will continue to make losses for a few more quarters.
Air India operates through large international and domestic markets, competing with leading world-class giant airlines as well as small local operators. This lack of clarification about the strategic path dilutes its strengths in large measure and confuses its brand within markets.
Low productivity, low power usage.
Growing Competitor base and low-cost carrier entry (LCC’s)
The high-cost structure of the airline and the compulsions to be a member of the public sector are the reasons it suffered a loss and will continue to make losses for a few more quarters.
Opportunities in the SWOT Analysis of Air India – Air India SWOT Analysis
India by population is the second-largest nation in the world. So, imagine just how big the domestic market is for Air India is not difficult. The airline has growth opportunities in the domestic industry.
The demand for tourism is strong worldwide. Airline industry de-regulation also makes airlines more open to the global skies than ever before. Both the demand for tourism and the deregulation definitely provide prospects for international growth for Air India. Most observers consider the recent decision by the airline to launch its second long-haul route three times a week from Mumbai to London Stansted Airport, a step in the right direction.
India ‘s airline industry is growing faster and will continue to expand as GDP increases, and it is expected that the trend will continue until the slowdown falls.
Worldwide deregulations make skies more accessible; it is easier to find consensus on the road. India’s number of international tourists and investors is growing rapidly.
Complementary industries such as tourism would raise demand for airline services. The strict supervision and safety by the Ministry of Civil Aviation present incentives for restructuring and optimization.
Customers are more affluent, tend to be less price-conscious, and choose quality service over cost.
Air India has an opportunity to launch a Low-Cost Carrier.
Threats in the SWOT Analysis of Air India – Air India SWOT Analysis
The final item to be considered in Air India’s SWOT analysis is a hazard. Air India is facing stiff competition on its foreign routes from some of the world’s biggest airlines. Small local airlines and their price wars are also considered threats to Air India.
Air India is facing imminent hostile competition from the world’s leading airlines, and domestic-led price wars.
The Indian Railway Ministry has significantly increased speed and reliability on its medium to long-distance routes, drawing passengers away from air reliability, with rates nearly equal to those of low-cost carriers
If you like This Article Please Like our Facebook Page PROJECTS4MBA
Cite This Work
Referencing Style to cite this article: [citationic]